
UX CASE STUDY
UX CASE STUDY
duration
duration
4 weeks
4 weeks
Project Type
Project Type
Personal Project
Personal Project
my role
my role
UX & UI Design
UX & UI Design
OVERVIEW
OVERVIEW
LabLens bridges the gap between raw data and human understanding. It simplifies medical reports by translating complex jargon into plain English, offering visual severity grades, and empowering patients to have better conversations with their doctors.
LabLens bridges the gap between raw data and human understanding. It simplifies medical reports by translating complex jargon into plain English, offering visual severity grades, and empowering patients to have better conversations with their doctors.
What is the first thing people do when they see a
high flag on their medical report?
They don't call their doctor immediately. They panic. They open a new tab. And they type "High Lymphocytes causes" into Google.

CORE CHALLENEGE
CORE CHALLENEGE
The problem isn't that patients lack access to their data; it's that the data is encrypted in jargon. The challenge was to design a system that offers Medical Accuracy without Medical Jargon creating a translator that is empathetic enough to calm a patient but precise enough to be trusted.
The problem isn't that patients lack access to their data; it's that the data is encrypted in jargon. The challenge was to design a system that offers Medical Accuracy without Medical Jargon creating a translator that is empathetic enough to calm a patient but precise enough to be trusted.
DESIGN PROCESS
DESIGN PROCESS

Deep Dive into Global Health & User Sentiments
Deep Dive into Global
Health & User Sentiments
A deep dive research into global health data and user sentiments was done. Data from the CDC, WHO, and Pew Research were analyzed to quantify the scale of the issue. Forum discussions (Reddit/Quora) were analyzed and informal interviews were conducted with early (20s) and late (40s) career professionals to capture the emotional reality. The goal was to quantify the Health Literacy Gap and map the emotional journey of patients navigating the medical system alone.
A deep dive research into global health data and user sentiments was done. Data from the CDC, WHO, and Pew Research were analyzed to quantify the scale of the issue. Forum discussions (Reddit/Quora) were analyzed and informal interviews were conducted with early (20s) and late (40s) career professionals to capture the emotional reality. The goal was to quantify the Health Literacy Gap and map the emotional journey of patients navigating the medical system alone.
Desk Research
Desk Research
90% Gap
According to the CDC, nearly 9 out of 10 adults struggle to understand routine medical advice and health statistics.
Cognitive Load
A standard Comprehensive Metabolic Panel (CMP) contains over 14 distinct biomarkers and 30+ numerical data points, creating immediate cognitive load.
Forgotten Info
40-80% of the medical information patients receive is forgotten immediately, and nearly half of what is remembered is incorrect.
72% Reliance
72% of internet users say they looked online for health information within the past year.
40% Anxious
Research shows that 40% of people who self-diagnose online report increased anxiety levels afterward.
12% Proficient
Only 12% of adults have "proficient" health literacy skills required to navigate our complex health system.
Portal Drop-Off
While 90% of hospitals offer patient portals, only 15-30% of patients actively use them due to poor UX and complex interfaces.
Wait Time
The average wait time for a specialist appointment to explain a result is 2 weeks or more, leaving patients in limbo for a long time.
Visual Preference
Studies show that 93% of communication is nonverbal; patients understand visual graphs 3x faster than numerical tables.
90% Gap
According to the CDC, nearly 9 out of 10 adults struggle to understand routine medical advice and health statistics.
Cognitive Load
A standard Comprehensive Metabolic Panel (CMP) contains over 14 distinct biomarkers and 30+ numerical data points, creating immediate cognitive load.
40% Anxious
Research shows that 40% of people who self-diagnose online report increased anxiety levels afterward.
72% Reliance
72% of internet users say they looked online for health information within the past year.
12% Proficient
Only 12% of adults have "proficient" health literacy skills required to navigate our complex health system.
Forgotten Info
40-80% of the medical information patients receive is forgotten immediately, and nearly half of what is remembered is incorrect.
Portal Drop-Off
While 90% of hospitals offer patient portals, only 15-30% of patients actively use them due to poor UX and complex interfaces.
Wait Time
The average wait time for a specialist appointment to explain a result is 2 weeks or more, leaving patients in limbo for a long time.
Visual Preference
Studies show that 93% of communication is nonverbal; patients understand visual graphs 3x faster than numerical tables.
Qualitative Analysis
Qualitative Analysis
Users default to the most extreme diagnosis immediately upon seeing a High flag.

I saw abnormal next to my kidney function and assumed I needed dialysis. Turns out I was just dehydrated.
The time gap between receiving a digital report notification and actually speaking to a doctor is the peak window for mental distress.
My results came in on a Friday night, but my appointment wasn't until Tuesday. I spent the entire weekend staring at the PDF, all anxious.
Comparing a decimal value (e.g., 0.4) to a range (e.g., 0.4 - 4.0) is mentally taxing and prone to error.
I hate doing the mental math. Just tell me if I'm safe or not. Don't make me compare my number to the bracket.
Many users aren't analyzing their own reports, they are trying to translate results for aging parents or children, adding a layer of responsibility and pressure.
I have to explain these numbers to my mom, but I don't even understand them myself. I feel guilty that I can't reassure her.
Users rarely track history, they only look at the current snapshot, missing critical long-term changes.
I have 2 years of PDF reports sitting in my email. I have no idea if my cholesterol is going up or down.
Medical terms feel exclusionary, creating a power dynamic where the patient feels small.
It feels like they write these reports in a secret code so you have to pay for another visit just to understand them.
Users crave color coding to help them process information quickly
Why are these reports always black and white? Just put a red dot if it's bad and a green dot if it's good.
Ultimately, users don't want data, they want reassurance/validation.
I don't care about the milligrams per deciliter. I just want to know if I'm going to be okay.
Users know Googling is bad for them, but they do it anyway because they feel they have no choice.
I promised myself I wouldn't Google it. I did anyway. Now I'm convinced I have a rare blood disease.
Many users aren't analyzing their own reports, they are trying to translate results for aging parents or children, adding a layer of responsibility and pressure.
I have to explain these numbers to my mom, but I don't even understand them myself. I feel guilty that I can't reassure her.
Users rarely track history, they only look at the current snapshot, missing critical long-term changes.
I have 2 years of PDF reports sitting in my email. I have no idea if my cholesterol is going up or down.
Medical terms feel exclusionary, creating a power dynamic where the patient feels small.
It feels like they write these reports in a secret code so you have to pay for another visit just to understand them.
Users crave color coding to help them process information quickly
Why are these reports always black and white? Just put a red dot if it's bad and a green dot if it's good.
Ultimately, users don't want data, they want reassurance or validation.
I don't care about the milligrams per deciliter. I just want to know if I'm going to be okay.
Users know Googling is bad for them, but they do it anyway because they feel they have no choice.
I promised myself I wouldn't Google it. I did anyway. Now I'm convinced I have a rare blood disease.
Users default to the most extreme diagnosis immediately upon seeing a High flag.
I saw abnormal next to my kidney function and assumed I needed dialysis. Turns out I was just dehydrated.
The time gap between receiving a digital report notification and actually speaking to a doctor is the peak window for mental distress.
My results came in on a Friday night, but my appointment wasn't until Tuesday. I spent the entire weekend staring at the PDF, all anxious.
Comparing a decimal value (e.g., 0.4) to a range (e.g., 0.4 - 4.0) is mentally taxing and prone to error.
I hate doing the mental math. Just tell me if I'm safe or not. Don't make me compare my number to the bracket.
What does the current market look like?
What does the current
market look like?
While AI tools exist to digitize medical data, they often trade one type of friction for another. Most solutions fail to provide the instant clarity a panicked user needs.
While AI tools exist to digitize medical data, they often trade one type of friction for another. Most solutions fail to provide the instant clarity a panicked user needs.

INFORMATION OVERLOAD
Tools like NirogGyan generate comprehensive 10 page reports. While educational, they force a user who just wants to check one scary number to read a lengthy document.

VISUAL BLINDNESS
Patiently.ai and SlidesPilot rely heavily on text explanations. Without visual cues, users must read entire paragraphs to find their status.

HIGH BARRIER TO ENTRY
August AI is a mobile only application. Users searching on a laptop or unwilling to download an app for a single question are locked out of the ecosystem.

LACK OF CONVERSATION
Current report generators are static. If a user asks, "Is this serious?", the pdf cannot answer back. The interaction ends the moment the report is generated.


INFORMATION OVERLOAD
Tools like NirogGyan generate comprehensive 10 page reports. While educational, they force a user who just wants to check one scary number to read a lengthy document.
VISUAL BLINDNESS
Patiently.ai and SlidesPilot rely heavily on text explanations. Without visual cues, users must read entire paragraphs to find their status.
HIGH BARRIER TO ENTRY
August AI is a mobile only application. Users searching on a laptop or unwilling to download an app for a single question are locked out of the ecosystem.
LACK OF CONVERSATION
Current report generators are static. If a user asks, "Is this serious?", the pdf cannot answer back. The interaction ends the moment the report is generated.
PAIN POINTS
PAIN POINTS

Medical reports are written for doctors, relying on complex clinical terminology that alienates the average patient. This forces users to turn to external search engines just to understand basic terms like creatinine.
Jargon Barrier

Standard reports force users to perform mental math, comparing their specific decimal values against complex reference ranges (e.g., 0.4 - 4.5). This cognitive load makes it difficult to instantly grasp whether a result is safe or alarming.
Cognitive Load

When anxiety strikes, speed is critical, yet the current market forces users through high-friction barriers. Patients are required to download mobile apps or create accounts just to get a simple answer to a single question.
Friction Fatigue

Health is a long-term trend, but physical reports and static PDFs are isolated snapshots that get lost in drawers. Users lose the ability to track progress, making it impossible to see if their health markers are improving over time.
Trend Blindness
Medical reports are written for doctors, relying on complex clinical terminology that alienates the average patient. This forces users to turn to external search engines just to understand basic terms like creatinine.
Jargon Barrier
Jargon Barrier
Standard reports force users to perform mental math, comparing their specific decimal values against complex reference ranges (e.g., 0.4 - 4.5). This cognitive load makes it difficult to instantly grasp whether a result is safe or alarming.
Cognitive Load
Cognitive Load
When anxiety strikes, speed is critical, yet the current market forces users through high-friction barriers. Patients are required to download mobile apps or create accounts just to get a simple answer to a single question.
Friction Fatigue
Friction Fatigue
Health is a long-term trend, but physical reports and static PDFs are isolated snapshots that get lost in drawers. Users lose the ability to track progress, making it impossible to see if their health markers are improving over time.
Trend Blindness
Trend Blindness
USER PERSONAS
USER PERSONAS


How do we solve the translation crisis without replacing the doctor?
How do we solve the translation crisis without replacing the doctor?
The solution is to act as a Health Interpreter. The goal is not to diagnose diseases but to translate data. The solution relies on 3 pillars:
The solution is to act as a Health Interpreter. The goal is not to diagnose diseases but to translate data. The solution relies on 3 pillars:

Visual Context
Visual Context

Simple Language
Simple Language

Trend Tracking
Trend Tracking

STYLE GUIDE
STYLE GUIDE
Medical reports can be stressful, so I chose a visual style that feels safe and soothing instead of cold and clinical. I replaced the usual alarming red colors with natural greens to help users feel relaxed, and I paired a classic font with a modern one to balance medical trust with clarity.
Medical reports can be stressful, so I chose a visual style that feels safe and soothing instead of cold and clinical. I replaced the usual alarming red colors with natural greens to help users feel relaxed, and I paired a classic font with a modern one to balance medical trust with clarity.
Colors
Colors
#081C15
#081C15
#2D6A4F
#2D6A4F
#74C69D
#74C69D
Type
Type
Header
Header
EB Garamond
EB Garamond
Regular
Regular
Body
Body
Urbanist
Urbanist
Regular, Bold
Regular, Bold
Logo
Logo

FINAL DESIGNS
FINAL DESIGNS
Home Page
Home Page


You either browse or drag & drop your report directly into the box, completely bypassing any signup barriers. The interface instantly recognizes the file and readies the scan.
You either browse or drag & drop your report directly into the box, completely bypassing any signup barriers. The interface instantly recognizes the file and readies the scan.
Report Page
Report Page


The results generate instantly, separating the urgent & healthy metrics so you know exactly where to focus. Curated questions for your doctor immediately & features like 'Recommended Actions' and 'Save Analysis' are locked to highlight the value of the premium tier.
The results generate instantly, separating the urgent & healthy metrics so you know exactly where to focus. Curated questions for your doctor immediately & features like 'Recommended Actions' and 'Save Analysis' are locked to highlight the value of the premium tier.
Pricing Page
Pricing Page
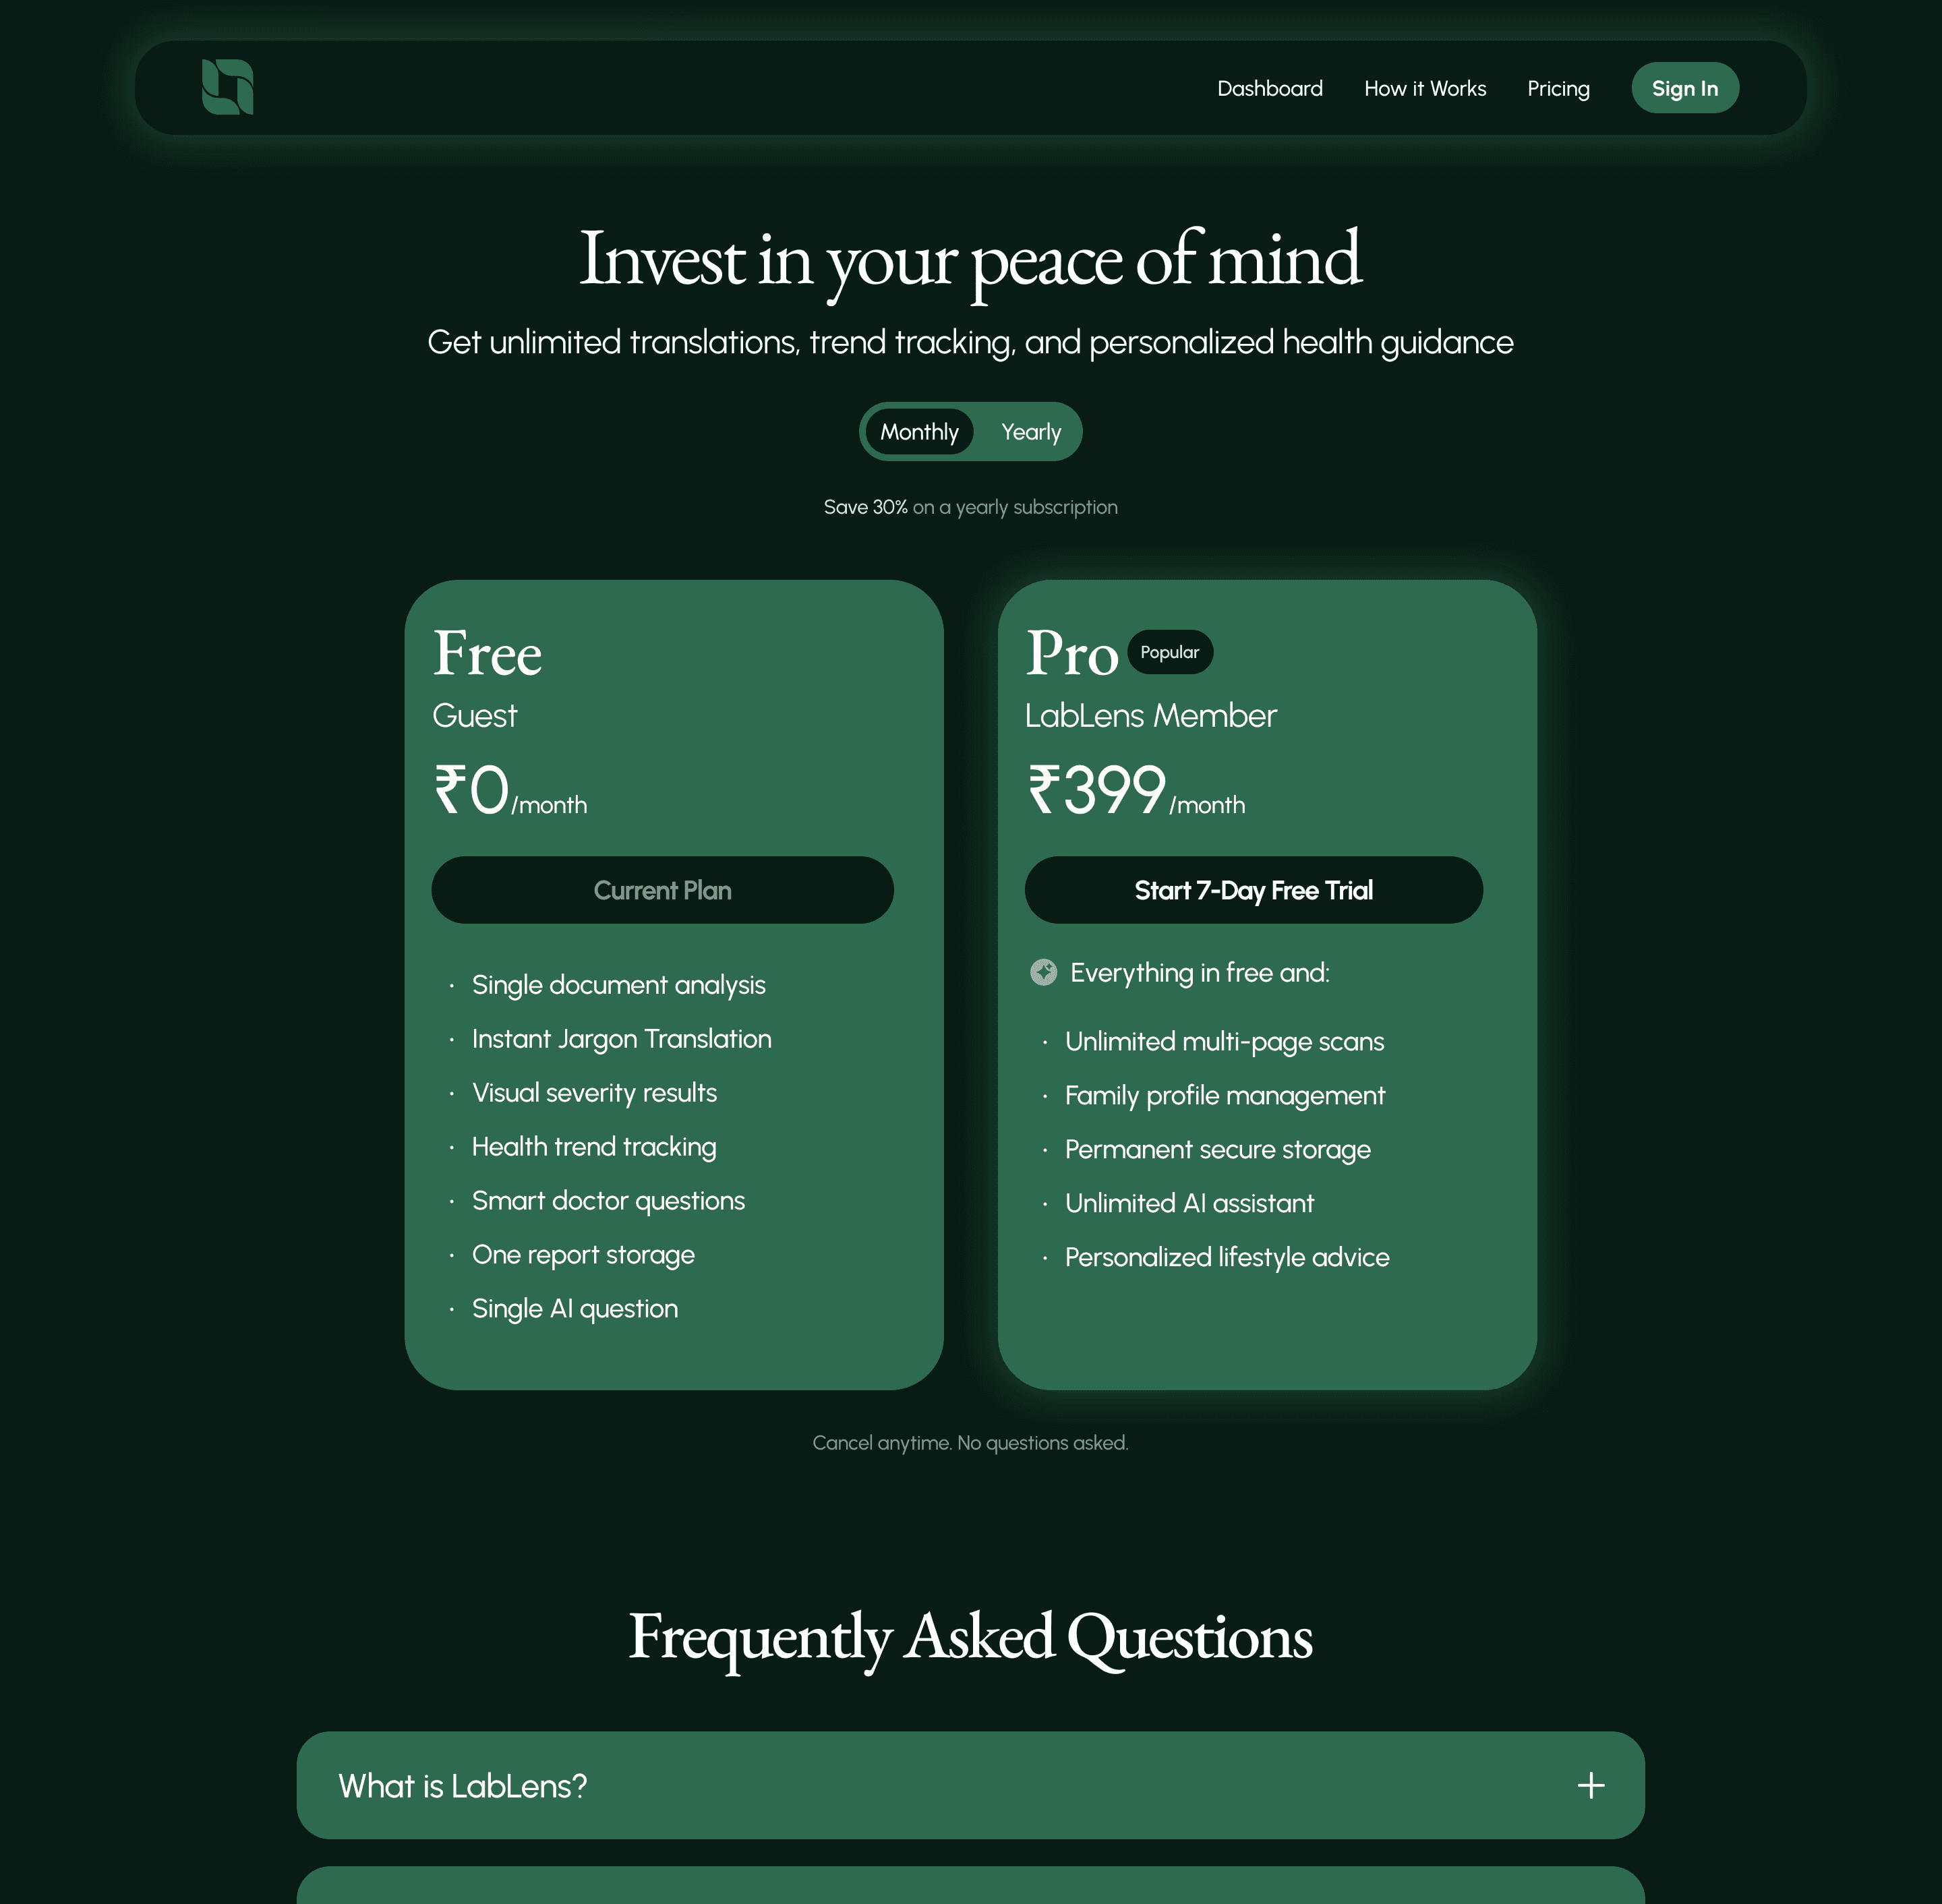

Clear, transparent pricing tiers empower users to choose the right level of care. The value of the Pro plan is highlighted and no essential features are hidden behind a paywall.
Clear, transparent pricing tiers empower users to choose the right level of care. The value of the Pro plan is highlighted and no essential features are hidden behind a paywall.
Dashboard Page
Dashboard Page


Accessible only to logged in members, the Dashboard transforms isolated data into a long-term health narrative. A graph visualizes progress over time, while metrics and locked AI insights highlight immediate priorities and the value of upgrading.
Accessible only to logged in members, the Dashboard transforms isolated data into a long-term health narrative. A graph visualizes progress over time, while metrics and locked AI insights highlight immediate priorities and the value of upgrading.
How it works Page
How it works Page


This page shows a clear 3 step visual guide and demystifies the AI process, using a direct comparison to validate user pain points. It shows the privacy guarantees and builds the necessary trust to encourage that first frictionless upload.
This page shows a clear 3 step visual guide and demystifies the AI process, using a direct comparison to validate user pain points. It shows the privacy guarantees and builds the necessary trust to encourage that first frictionless upload.
Sign up Page
Sign up Page

This page features prominent one-tap social logins which eliminates password fatigue, ensuring that returning to check long term health trends is as effortless as the initial scan.
This page features prominent one-tap social logins which eliminates password fatigue, ensuring that returning to check long term health trends is as effortless as the initial scan.
OTHER SCREENS & FEATURES
OTHER SCREENS & FEATURES


Kara your assistant proactively interprets flags, offering immediate context rather than just defining terms. This flow establishes trust by answering one critical question for free, using the user's desire for further reassurance to naturally introduce the premium upgrade.
Kara your assistant proactively interprets flags, offering immediate context rather than just defining terms. This flow establishes trust by answering one critical question for free, using the user's desire for further reassurance to naturally introduce the premium upgrade.
For signed in users, this profile dialog acts as the command center for your account. It enables seamless switching between family profiles, essential for caretakers managing parent's health and provides instant, one click access to your saved reports.
For signed in users, this profile dialog acts as the command center for your account. It enables seamless switching between family profiles, essential for caretakers managing parent's health and provides instant, one click access to your saved reports.
REFLECTIONS & TAKEAWAYS
REFLECTIONS & TAKEAWAYS
My initial designs were clean but cold. Users felt disconnected from their own health data because it looked too much like a spreadsheet. I learned that adding human elements like conversational AI and reassuring color palettes transforms a medical report from a source of fear into a tool for empowerment.
My initial designs were clean but cold. Users felt disconnected from their own health data because it looked too much like a spreadsheet. I learned that adding human elements like conversational AI and reassuring color palettes transforms a medical report from a source of fear into a tool for empowerment.
I realized that telling a user what is wrong is only half the job, telling them what to do next is the real value. Early iterations failed because they stopped at the data. Adding clear, actionable steps (questions for your doctor) turned out to be one of the most critical features for reducing user anxiety.
I realized that telling a user what is wrong is only half the job, telling them what to do next is the real value. Early iterations failed because they stopped at the data. Adding clear, actionable steps (questions for your doctor) turned out to be one of the most critical features for reducing user anxiety.
Designing the upgrade flow taught me that monetization shouldn't feel like a blockade. Instead of locking the result, we locked the history & deep context which feels like value. This shift turned the Paywall into a Value Extension, respecting the user's immediate need while sustaining the business model.
Designing the upgrade flow taught me that monetization shouldn't feel like a blockade. Instead of locking the result, we locked the history & deep context which feels like value. This shift turned the Paywall into a Value Extension, respecting the user's immediate need while sustaining the business model.
What is the first thing people do when they see a high flag on their medical report?
They don't call their doctor immediately. They panic. They open a new tab. And they type "High Lymphocytes causes" into Google.
Table Of Contents